


Mixed economic numbers have turned that smile upside down among interest-rate watchers, as inflation persists and employment stays healthy. This divergence of data put the mortgage market on its heels over the past several weeks and essentially reset rates after trending lower in December and January.
As a result, home buyers and sellers across Seattle/King County saw a mixed bag of activity in February, according to the Northwest Multiple Listing Service (MLS). Home sales figures were little changed in the county as a whole year-on-year (YoY) but varied widely by city, while home prices reached double digits amid growing demand.
This return of buyers follows a sluggish late 2023. About two-thirds of all King County listings sold last month at the list price or above, signaling a competitive environment and extending this long-running sellers’ market.

February was also marked by a healthy increase in activity compared with January and a steady rise versus this time last year. The 40% climb in sales (1450 homes) from January to last month looks impressive but it was coming off a slow stretch and essentially flat compared to a year ago.
Sales were up a solid 11% (585) over the past year in Seattle, but down 14% (265) in Southeast King (Enumclaw, Black Diamond) while down a slim 0.3% (388) on the Eastside. Pending sales in February – an early indicator of future closings – show a 20% (2061) monthly increase and up 3.8% across the county for all home types combined.
The median price of a home in King County jumped 7.9% in the month and is now 13% stronger YoY; this covers all types of homes – single-family, townhome and condo. The picture was somewhat similar for single-family homes as a stand-alone category, with new listings up 38% (1845) and sales 41% (1064) stronger month-to-month, but the YoY numbers were more telling, up 31% and down 4.2%, respectively.
Some single-family highlights include a 61% (549) monthly jump in new listings on the Eastside and an 83% (422) surge of closed sales in Seattle. On an annual basis, those same figures were up 43% on the Eastside and 7.7% in Seattle.
About those prices: They rose in all but five of the county’s 30 submarkets. Across all home types, Kirkland experienced the biggest YoY median price increase – 46% ($1.64M) – while an area covering Auburn, Covington and Lakeland suffered the biggest YoY decline at 12% ($501,000).
Single-family prices climbed across the board. Mercer Island experienced the sharpest increase, up 29% ($2.1M) YoY – on only 10 February sales – while the Auburn area saw prices fall 8.6% ($530,000). Elsewhere, single-family homes were going for a median price of $927,450 in Seattle (up 6.7% in a month and 12% YoY) and $1.47M on the Eastside (up a slight 0.3% month-to-month and 9.7% for the year).
The county as a whole saw single-family prices break above the $900K level for the first time since last August to $914,500 – the highest level since June ($935K). (I stand by my late 2023 prediction that single-family median prices will surpass the $1M mark this year for the first time.) February’s price was 7.6% higher than January and 14% stronger than a year ago.
Our county’s condo market continued its recent activity boost with 39% (386) more sales than a month ago and 15% better than last year’s figures. Sales skyrocketed 77% (131) on the Eastside in February compared with January and were 9.2% higher YoY. The median price of a condo in King stood at $550,000, up a healthy 11% for the month and 17% for the year; the Eastside market led the way with a median price rise of 17% for the month and 23% YoY to $665,000. A typical Seattle condo fetches $558,000, up 3.8% since January and 8.4% YoY. There is 1.9 months’ supply of condos across King County, down significantly from 2.4 months in January.
Months of inventory continue to be a burden on all buyers. The overall county-wide market had only 1.5 months’ inventory, or 45 days before the existing supply would be exhausted if not replenished. That’s down from 1.8 months in January. Inventory is at 1.3 months on the Eastside (down from 1.6) and 1.7 in Seattle (slumping from 2.5). Supply is thinner in the single-family segment, at 1.3 months for Seattle, the Eastside and the county overall.
In addition to King County’s 7.9% median price boost month-to-month on all home types, to $820,000, Snohomish County saw a 2.1% rise ($715,000) and Pierce added 2.0% ($536,975). Kitsap bucked the trend, with median prices down a surprising 5.6% ($519,000) since January. Single-family home prices in King jumped 7.6% for the month ($914,500), as noted above, followed by Snohomish (up 2.9% to $750,990) and Pierce (up 1.9% to $550,000). Again, Kitsap stumbled, down 5.5% ($519,500) for the month. Year-to-year, single-family median prices were all higher, led by King’s strong 14% advance, followed by an 8.8% jump in Snohomish, 3.9% higher in Kitsap and 3.8% in Pierce.
Affordability remains the toughest hurdle to overcome for most buyers. Researchers at the University of Washington track this metric and the Q4 report, recently released, showed its affordability index reached historic lows in Seattle, Bellevue, Federal Way and other King County areas for buyers, including first-timers in a separate index. Mercer Island is deemed the least affordability city in the county, according to the university’s Washington Center for Real Estate Research.
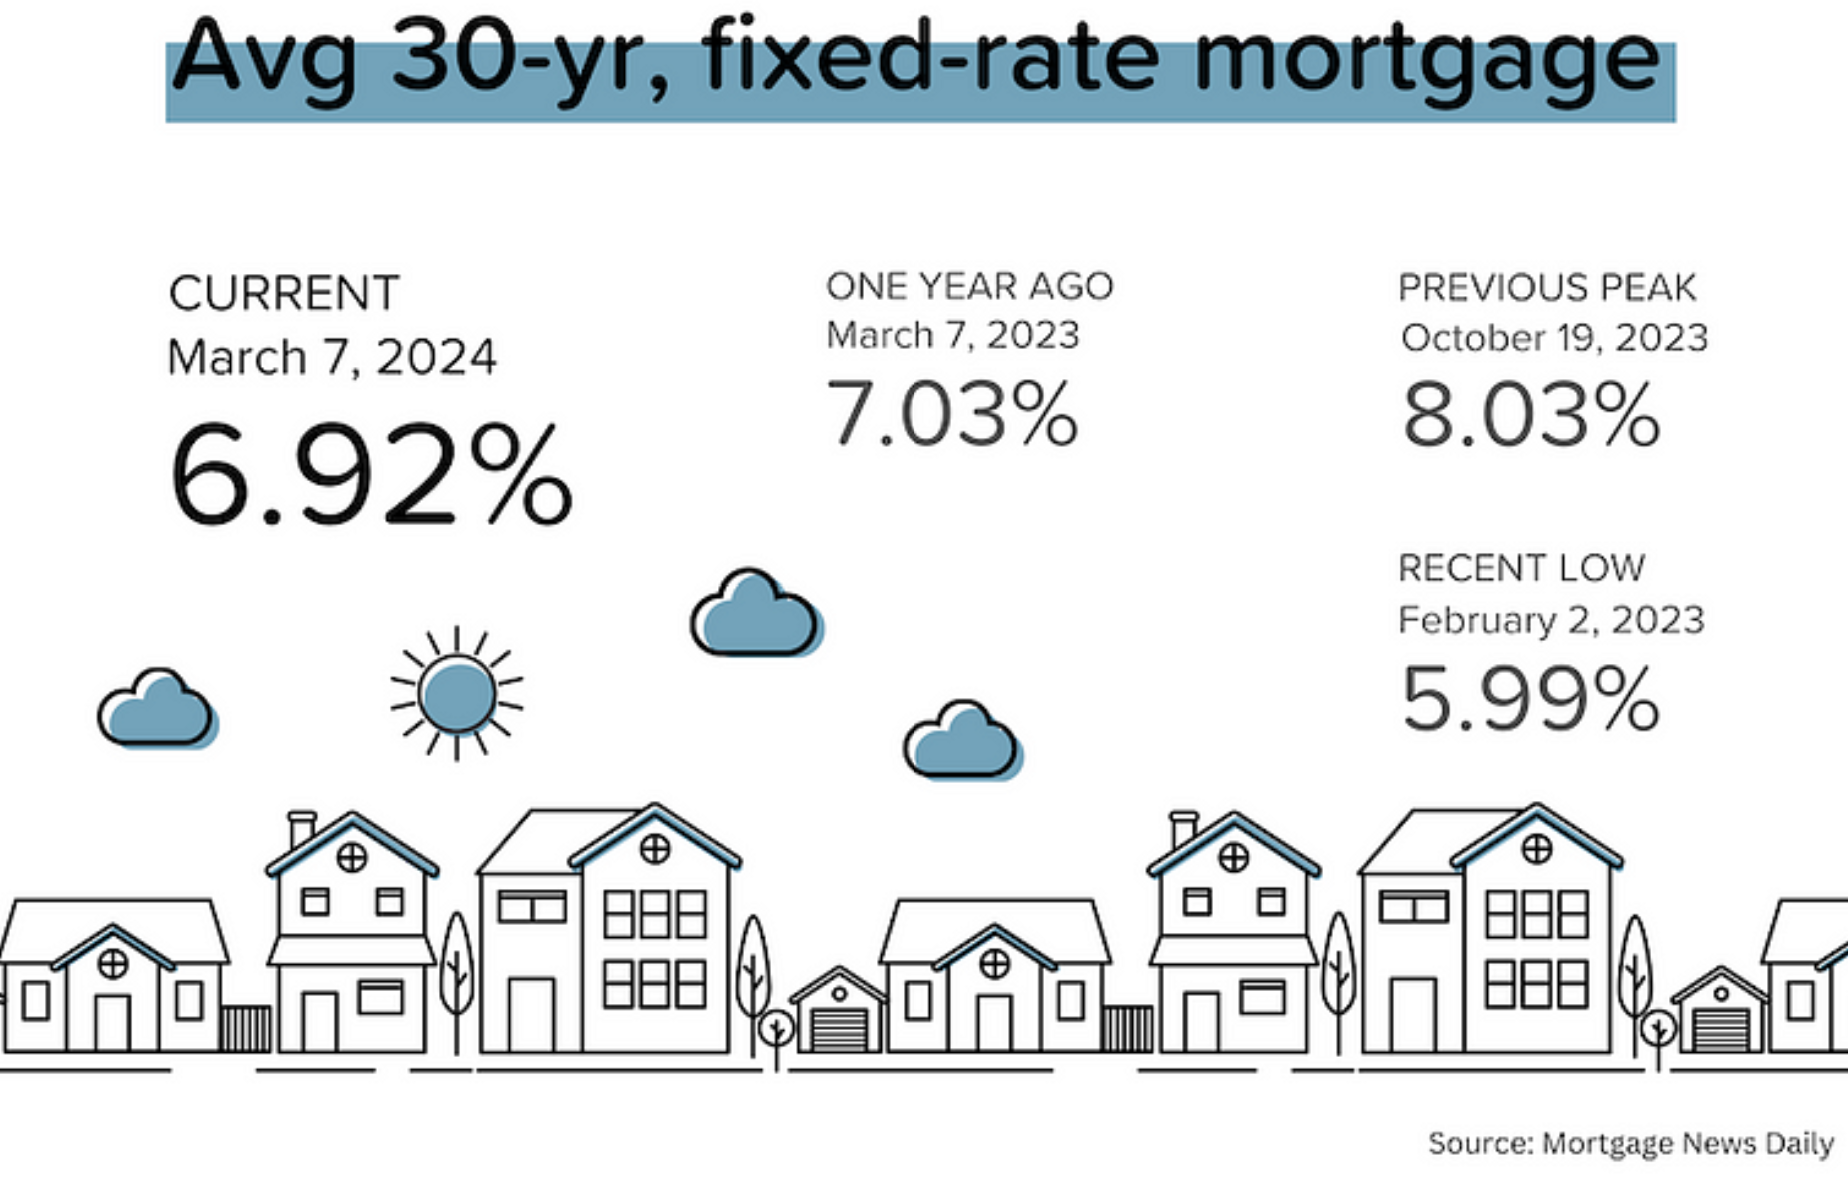
Rising mortgage rates are the main culprit for this affordability challenge. Rates zipped above 7.0% in February after inflation was reported to climb month-to-month by one-third of a percentage point. Experts expected the rate of inflation to decline. This caused market movers to sell their bond and mortgage securities holdings amid greater certainty the credit environment will remain sluggish for longer than expected.
Data for consumer prices suggest a reacceleration of inflation could be a possibility, temporarily dashing hopes for a drop in interest rates for things like car loans, credit card debt and mortgages.
The Fed signaled late last year that it plans to dial down its rate on short-term loans offered between banks by about 0.75 percentage points by the end of this year – assuming inflation continued a downward trend. The U.S. central bank does not directly control mortgage rates but it can influence the people – mortgage investors – who do.
The government issued its latest consumer price index update on March 12, as this article was published.
Meantime, job growth remains consistent even while slowing compared to previous years. As more people join the U.S. workforce, consumer spending also typically climbs while causing inflation to persist.
“While mortgage rates remain too high for many prospective buyers, we anticipate that due to pent-up demand, many more buyers will enter the marketplace if mortgage rates continue to decline this year,” said Alicia Huey, chairperson of the National Association of Home Builders (NAHB).
Ultimately, we need mortgage rates to move down to improve both affordability (lower monthly payments) and availability (freeing up previously “locked in” sellers). The next Fed rate decision is on March 20 but there is little hope of a change.
“The job market is solid, and the country’s total wealth reached a record high due to stock market and home price gains,” stated Lawrence Yun, chief economist for the National Association of Realtors® (NAR). “This combination of economic conditions is favorable for home buying. However, consumers are showing extra sensitivity to changes in mortgage rates in the current cycle, and that’s impacting home sales.”
On a different front, the median age of owner-occupied homes is now 40 years old – a figure that has been rising for two decades. Why? Because new home construction hasn’t kept up.
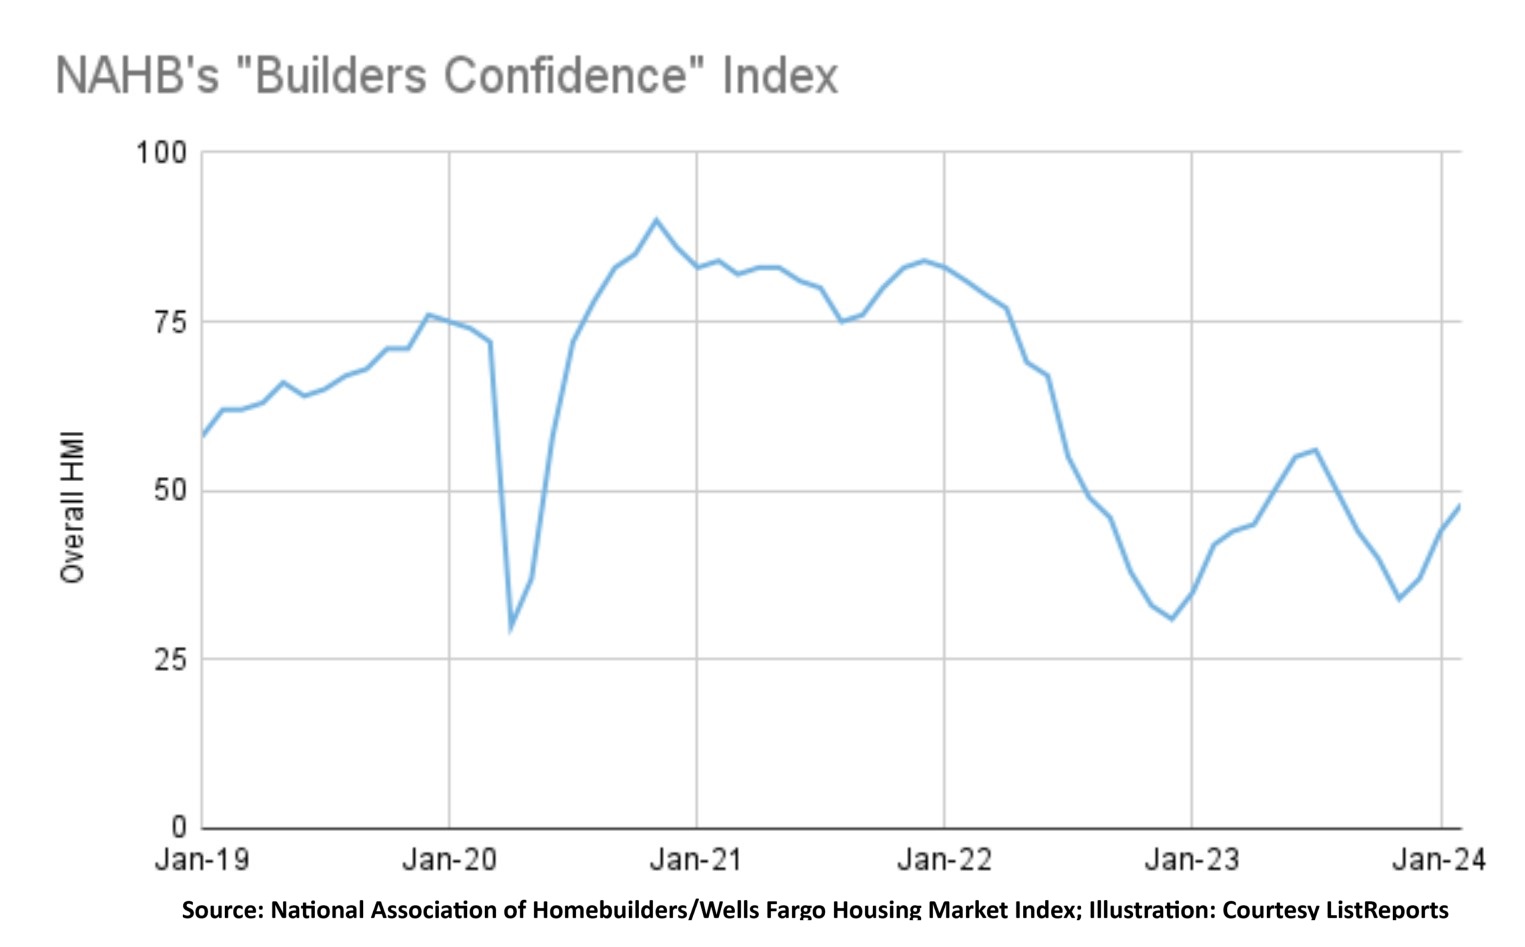
The NAHB’s confidence index climbed four points to 48 in February (above 50 = bullish). That’s the highest level since August 2023 and is the third straight month of improvement. The index has inched higher each month since a reading of 34 in November.
Confidence is one thing but hard evidence of housing growth is another. Data from NAR shows housing starts fell 15% month-to-month in January, including a disappointing 37% fewer among the multi-family-housing category.
Builders have confronted a litany of obstacles in their attempt to develop more homes. NAR cited poor weather in January as a contributing factor, but builders continue to face other issues – higher labor costs, zoning regulations, municipal impact fees and financial constraints such as rent control policies in some parts of the country.
What does this mean? Until we construct hundreds of thousands more homes across the country, we will be known as a home renovation nation.
“Over the last couple of quarters, the number of open jobs in construction is rising again,” noted NAHB’s chief economist, Robert Dietz. “That’s a forward signal that suggests hiring is continuing and what’s happening, particularly in the homebuilding sector, is an expectation that single-family home buildings are going to expand in 2024.”
Builders are expected to shift capital and labor from multi-family construction to more single-family structures over the next few years. We have already seen multi-family construction permits decline over the past year and that should lead to a changing landscape for builders and buyers.